Grid-connected battery storage is an exciting, new and rather mysterious technology. This blog is the second in a series that will help equip utilities to demystify battery storage for their residential customers.
The first blog post discussed ways residential customers could benefit from battery systems. This post explores one scenario: solar self-consumption under a flat rate structure. Under a flat rate structure, electricity prices don’t depend on the time of day. This post also explores ways in which utilities can help their customers understand the value of using battery storage with their PV system, and how they can plan for and track residential battery storage in their service territory.
Battery storage design and energy requirements for solar self-consumption
A designer needs to specify battery system capacity once a customer has selected the purpose of the battery, such as providing back-up power or shifting energy to get the most value out of their system. Design parameters include both energy and power requirements. That is, how many kWh (energy) of storage will the batteries provide and what is the maximum kW (power) rate of charging and discharging?
While the scope of specifying a battery system is beyond this article, utilities can provide helpful information to their customers.
Battery operation on peak load days
Assume that the customer is interested in batteries for self-consumption. It’s useful to illustrate how to perform the analysis using actual data. Figures 1, 2 and 3 below are based on data for a very efficient home (a Solar+ home—read more in the whitepaper “Driving Strategic Technology Adoption with Solar+ Homes”) in Napa, California, starting at 8 a.m. on September 1, 2017, the hottest day of 2017 in that location.
The black line in each figure corresponds to the customer’s gross load. The dashed red line in each figure corresponds to the net load. The utility delivers power to the customer to meet load when net load is positive. The utility or battery absorb excess production when net load is negative.
The solid areas of the graphs correspond to the energy provided to meet the load.
- Red – energy provided by the utility
- Green – energy provided by PV
- Blue – energy provided by the batteries
The patterned areas correspond to the energy sent back to the utility (green) or stored (blue).
Figure 1 presents consumption without PV or batteries. Gross load and net load are the same in this case. The black line is not visible because it’s beneath the dashed red line.
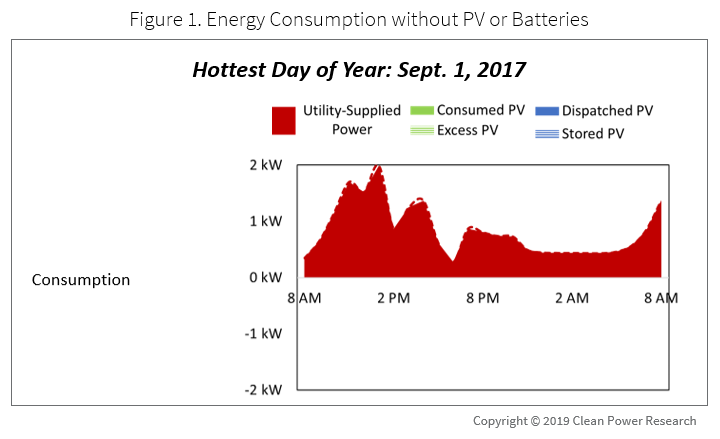
Figure 2 presents net consumption after subtracting out PV production but with no batteries. This was the actual setup for our test Solar+ home. The solid green and patterned green areas correspond to self-consumed PV and exported PV, respectively.
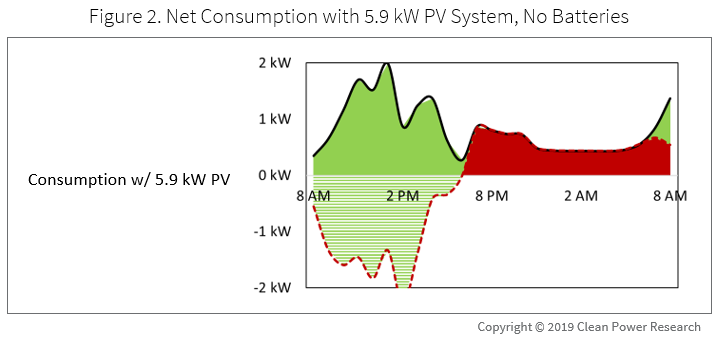
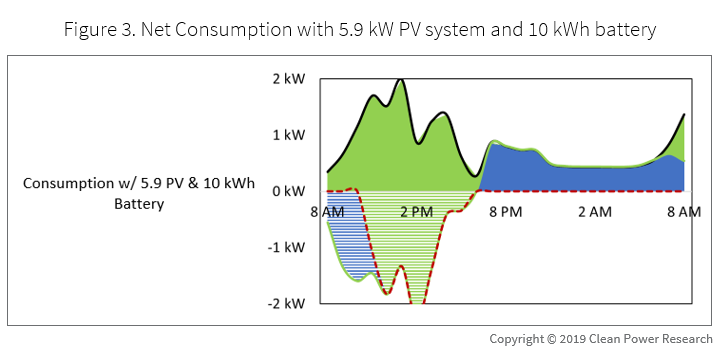
Figure 3 presents how this home would have performed with a 10-kWh battery used for solar-self consumption. The solid blue and patterned blue areas correspond to stored and dispatched PV energy, respectively. PV export (patterned green area) still exists, even with the battery, because of insufficient loads during non-solar hours.
Under a flat rate structure, a battery is operated to accept all excess solar production until it’s full. After that, the PV system exports excess production to the grid. The stored PV energy area is slightly less than the dispatched PV area because the system carried some energy over from the previous day.
Annual battery operation
Now, rather than evaluating the use of storage for only the peak load day, consider annual battery operation. While performing the analysis in one step provides accurate results, dividing the problem into a series of steps will provide customers with a deeper understanding of how the analysis is performed.
It’s instructive to take a four-step approach:
- Start with PV energy production
- Determine the maximum amount of PV directly available for self-consumption
- Evaluate the maximum amount of PV production available for storage and then self-consumption
- Select a battery capacity and determine the actual amount stored and consumed
One can perform the analysis using measured, hourly net load data such as is available from many utilities, combined with measured or simulated PV production data, available from SolarAnywhere® SystemCheck®.
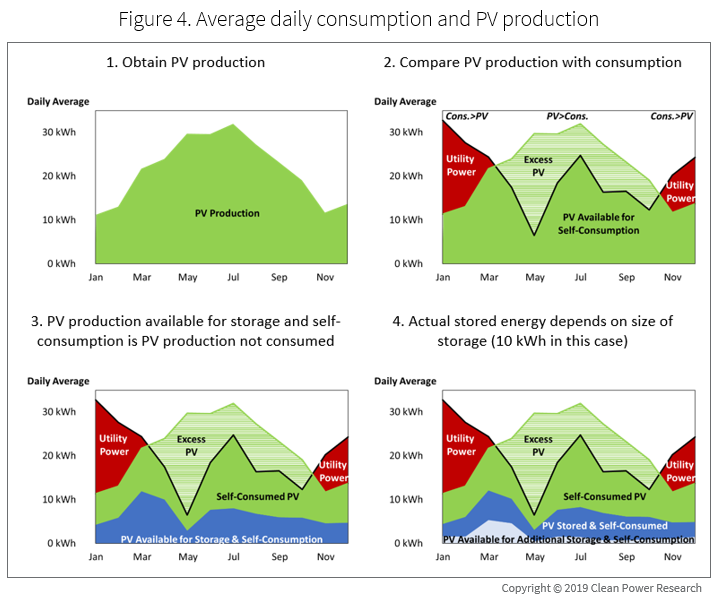
Consider an example using the same home as in the previous section. The following four graphs that are part of Figure 4 are based on 2017 measured hourly consumption and PV production. They present the results on an average daily basis for each month of the year.
- Calculate PV Production. This is the average daily PV production calculated monthly over the year. The top left graph illustrates this step. The PV system produced an annual average of 21 kWh per day. Production was lower in the winter and higher in the summer.
- Calculate PV Available for Self-Consumption. This is the upper limit on the amount of PV production that the home could use for self-consumption with or without storage. The top right graph illustrates this step. Either consumption or production could limit PV Available for Self-Consumption. PV production is the limiting factor in the winter when daily load exceeds daily PV production. Consumption is the limiting factor in the summer when daily PV production exceeds daily load. This effect is particularly apparent in May when the home was unoccupied and could only use a small amount of PV for self-consumption. There was an annual average of 6 kWh per day of Excess PV (the light green area) due to the seasonal mismatch. The home could not use this excess production even with a daily-cycled battery; only very expensive seasonal storage using a much larger battery could store this excess production.
- Calculate Self-Consumed PV and PV Available for Storage and Self-Consumption. This requires evaluating the hourly match between consumption and PV production. Self-Consumed PV corresponds to the energy where consumption and production match on an hourly basis; PV Available for Storage and Self-Consumption is the remainder. PV Available for Storage and Self-Consumption is all excess PV energy available after direct self-consumption that does not exceed the amount of daily utility-supplied energy. There is no benefit to storing additional energy once PV production reaches this storable amount because there is insufficient load to use it. The bottom left graph illustrates this step. Notice that Self-Consumed PV increased for this home in July 2017 when the home installed a controlled EV charging device that resulted in a good match between consumption and production.
- Calculate PV Stored and Self-Consumed. Select a battery size and determine how much of the PV Available for Storage and Self-Consumption the batteries actually store. The bottom right graph illustrates this step for a 10-kWh battery. The graph shows that an annual average of 9 kWh per day were directly Self-Consumed PV (green area) and an annual average of 5 kWh per day were PV Stored and Self-Consumed (blue area) for a total 14 kWh per day. This means that about two-thirds of the annual average of 21 kWh per day of PV Production was self-consumed either directly or indirectly using storage.
Residential customers should then calculate the economics based on actual stored PV energy, taking into account the charge/discharge cycle life of the battery. This result depends on the storage capital cost, storage life, customer behavior and PV system performance.
Conclusions
Purchasing a battery system is a complex decision. Residential customers must begin with a clear understanding of why they want battery storage. Is it to partially or fully backup home loads, shift solar power production to non-solar hours, or something else?
Once they have made this decision, they need to understand the financial benefit. Customers can determine the cost side of the equation by getting quotes. They also need to understand the value side of the equation. The discussion above demonstrates that understanding the value side requires some complex analysis. Utilities can provide customers with WattPlan® to simplify this analysis and help them determine the economic benefits of self-consumption.
An important question for utilities is “which customers are most likely to adopt battery storage?” Adoption data is important in both system planning and economic forecasts. WattPlan® Grid can help utilities understand adoption with easily updated scenarios.
Finally, utilities need to add batteries to their interconnection processes. This can be easily managed in PowerClerk®.