 SolarAnywhere Posts | Dec 5, 2013
In keeping with our mission of powering intelligent energy decisions, Clean Power Research is introducing a 10 km Typical Meteorological Year (TMY) dataset for use in Clean Power Research API services. Programmatic access to this high-resolution dataset and the...
SolarAnywhere Posts | Nov 14, 2013
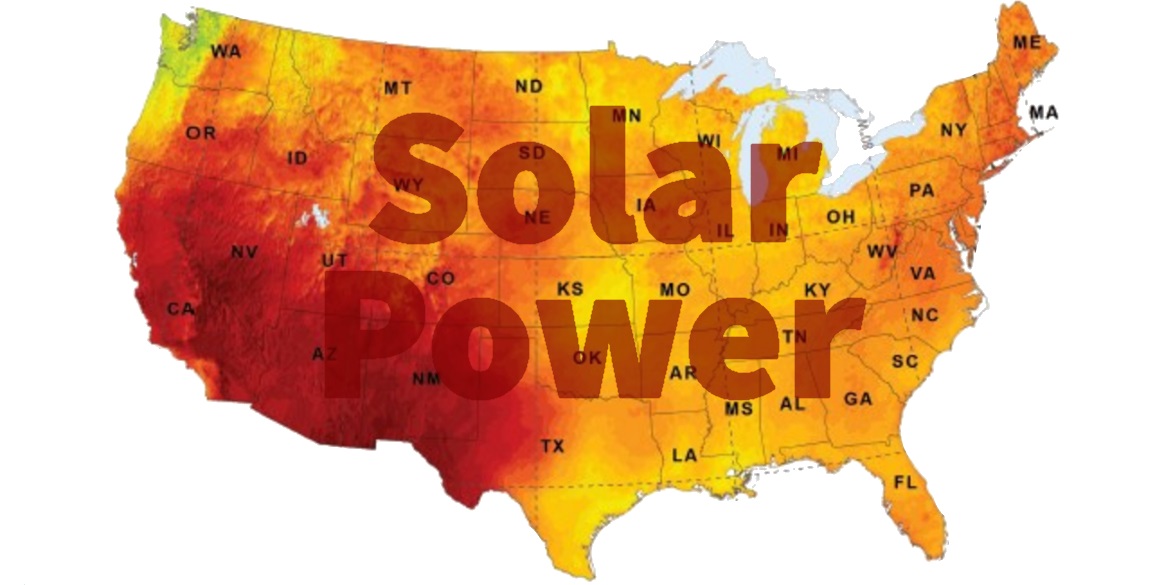
Determining whether solar is right for you depends in large part on the amount of solar resource available where you live. Each month, we generate the PV Power Map using SolarAnywhere® irradiance data. These maps provide more than just an indication of the solar...

SolarAnywhere Posts | Aug 22, 2013
Greentech Media’s recent article “How to Make Money from Land as a Solar Developer,” highlighted critical steps in the development of large solar projects that can make or break profitability. These include sizing the plant, applying for interconnection and a power...

SolarAnywhere Posts | Jul 17, 2013
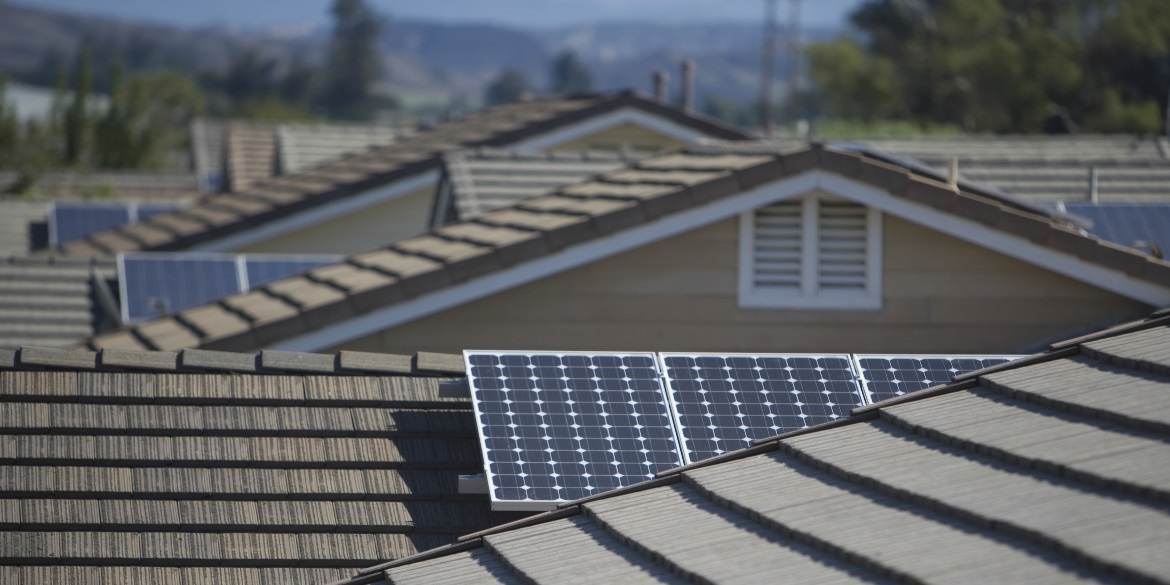
As we discussed in an article last month, it’s no secret that solar power generation can vary from season-to-season based on local weather conditions. So given this variability, how do PV system owners—whether residential, third-party, commercial or utility-scale...

SolarAnywhere Posts | Jun 27, 2013
A critical aspect of the financial health of solar leasing companies or other ‘third-party owners’ (TPOs) is the performance of their ‘fleet’ of installed PV. When a PV system is not operating at peak performance, it’s not producing as much power as expected,...