The utility and solar industries are in a heated debate about how to compensate customers who have distributed photovoltaic (PV) energy systems on their homes. Net energy metering (NEM) is currently the predominant approach used in the U.S. However, to understand any cost shifting associated with NEM, and to evaluate alternatives such as buy-all-sell-all tariffs, there is a growing interest in value of solar (VOS) calculations and methodologies.
Clean Power Research has performed numerous VOS analyses on behalf of organizations who have implemented, or who are considering implementing, VOS tariffs. Two of the most visible are VOS studies that formed the basis of the Austin Energy VOS tariff, and the VOS Framework Methodology developed by the Minnesota Department of Commerce for the State of Minnesota.
As a result of our work, we are frequently asked the question: “How can the value of solar be higher than the current average retail electricity rate?” This article provides one scenario that answers that question.
Average versus marginal costs
Customers who invest in distributed solar are helping the utility to avoid new, anticipated, future marginal costs, such as the costs of building new power plants or distribution lines to meet higher demand. VOS methodologies quantify the marginal value that solar provides utilities over the long-term.
In this way, VOS methodologies differ from the methodologies used to set electricity rates. The retail price is the average rate that enables the utility to collect the sunken capital costs and ongoing operational expenses needed to operate the utility today.
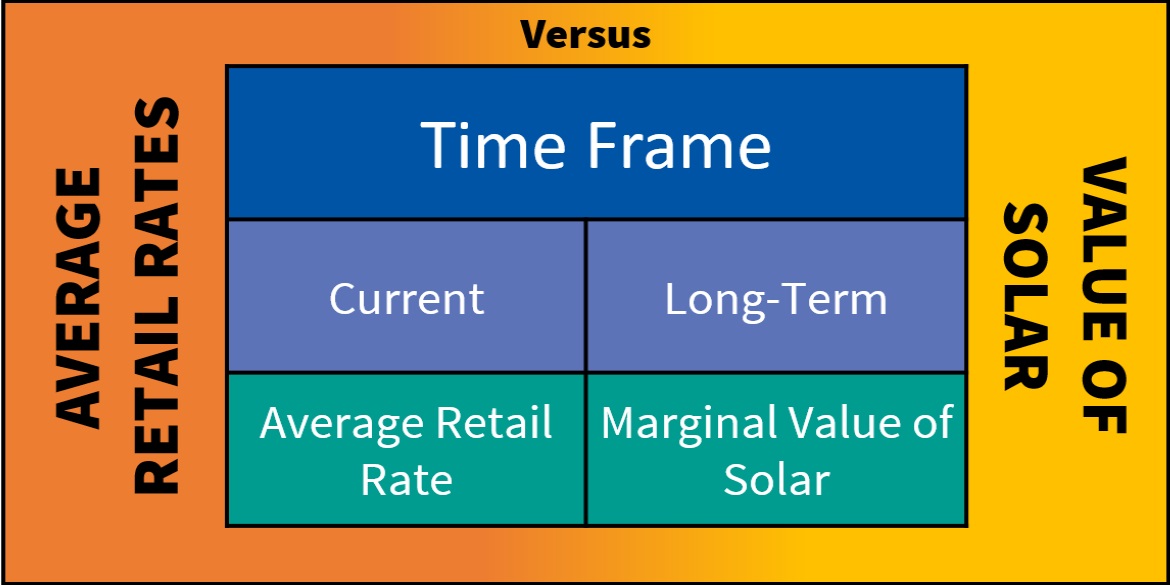
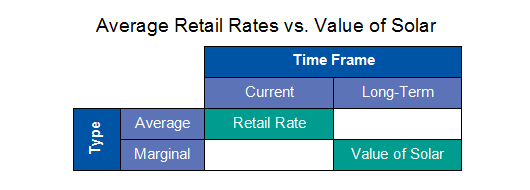
As illustrated in the following table, the retail rate is the average (not marginal), current (not long-term) rate. VOS methodologies seek to quantify the marginal (not average), long-term (not current) value that solar provides to the utility.
So what would we qualitatively expect when comparing retail rates to the VOS?
For the purpose of this example, we will consider only the effect that can exist between marginal and average costs. We should expect that the marginal cost for additional consumption will exceed the current average retail rate if:
a) the average retail rate is increasing over time; and
b) this increase is being caused by consumption growth.
In fact, not only should we expect this, but it must be true as a result of basic mathematics.
Calculating marginal cost
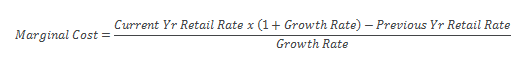
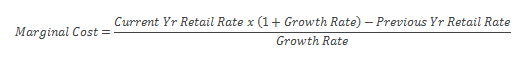
Consider a simple mathematical formulation (see below for more information on the formulation) to calculate marginal cost assuming that the Growth Rate is not equal to zero:
In order to illustrate how this equation works, take a simple example that uses the following assumptions:
-
- Previous year average retail rate is 10.0 cents per kWh.
- Current year retail rate is 10.1 cents per kWh.
- Consumption increased by 1 percent.
When these assumptions are input into the previous equation, the result is a marginal cost of 20.1 cents per kWh.

That is, while the average retail rate only increased by 1 percent (from 10.0 to 10.1 cents per kWh), the marginal cost underlying this increase is double the average retail rate, or 20.1 cents per kWh.
The answer to the question, “Is it rational for the value of solar to exceed the existing average retail electricity rate?” is yes under certain conditions. One situation in which VOS can exceed the existing average retail rate is if utility rates are increasing from year-to-year, and this increase is being caused by growth in consumption.
Want to learn more about Value of Solar? Read this related article: Transparency in the value of solar: When 9 cents equals 12 cents.
Marginal cost formulation
Here’s how we developed the formulation for calculating marginal cost assuming that the Growth Rate is not equal to zero.
The total revenue that a utility collects equals the average rate ($/kWh) times the number of kWh sold. Thus, the revenue collected in the current year equals the current year average retail rate times the current year quantity.

Likewise, the amount of revenue collected in the previous year equals the previous year average retail rate times the previous year quantity.

If revenues are cost-based and these costs are increasing due to consumption growth (assumption from above), the current year revenue can be expressed as the sum of the previous year revenue, plus the marginal cost associated with the marginal increase in quantity.

Current year quantity simply equals the previous year quantity, plus the marginal quantity.

Making the appropriate substitutions means that the current year revenue equals:

Express results on a percentage growth basis by dividing both sides by the previous year quantity.

Solve for marginal cost.