No Results Found
The page you requested could not be found. Try refining your search, or use the navigation above to locate the post.
No Results Found
The page you requested could not be found. Try refining your search, or use the navigation above to locate the post.
PV innovation gets a boost with new SolarAnywhere Public: Current, complete, no-cost solar data for select locations
Solar PV is poised to become the new “king of electricity generation” according to the International Energy Agency (IEA), which predicts solar to lead the surge in renewable power supply over the next decade. Across the U.S. alone, solar is expected to account for 40%...
Clean Power Research offers pvlib models via SolarAnywhere; joins pvlib open-source community
With the rapid growth of solar PV around the world, project developers, owners and operators need efficient and robust solutions to help them develop, operate and maintain PV systems at scale. Programmatic access to solar energy simulations helps stakeholders make...
SunCast podcast: Industry experts discuss the past, present and future of solar project financing
In the SunCast podcast “The Value of Data on Solar Project Finance,” I joined Nico Johnson, the podcast host, Heidi Larson from ICF, and Hoa Shen from kWh Analytics in a discussion about the past, present and future of solar project financing. The conversation focused...
Leveraging utility trusted advisor status to drive EV growth and grid reliability
The electric vehicle (EV) market continues to sizzle across the country, setting a record for quarterly sales in Q1 and Q2 of 2021. Through April 2021, EV sales were up 130 percent over 2020, and exceeded 2019 sales by 75 percent. Utilities have recognized the...
SolarAnywhere® Data coverage goes global with added support for East Asia and Oceania
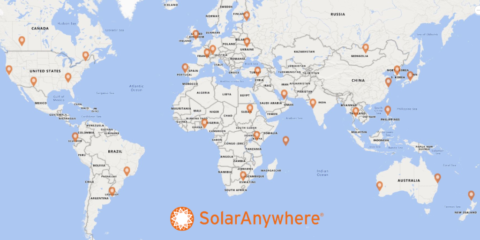
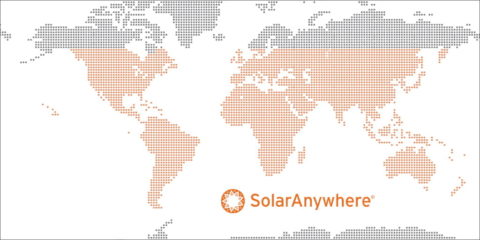
SolarAnywhere®, the industry’s leading solar data and intelligence service, now offers solar data services in East Asia and Oceania, including Australia and New Zealand. With the addition of this region, SolarAnywhere now provides full global coverage, including...
Reduce PV performance uncertainty with specific, data-driven snow-loss estimates using time-series data
A rapid decline in solar technology costs and ambitious federal and state-level renewable energy targets have accelerated the deployment of solar PV across diverse geographical regions. This has allowed solar generation to become viable even in northern latitudes and...
2021 Solar Risk Assessment Report: Data insights to mitigate financial, operating and natural catastrophe risk
With solar accounting for 43% of new generation capacity in the U.S. in 2020—an industry record—the kWh Analytics’ Solar Risk Assessment report is more important than ever to maintain the collective credibility of the solar industry. The third annual installment of...
Clean Power Research & 8minute Solar Energy Partner on R&D for Probabilistic Forecasts
Renewables have dominated the growth of new bulk power generation sources over the past five years. Driven by favorable policy, rapid declines in cost, improvements in technology, and fast time to market, as of 2019, solar power plants made up 29 GW of the existing...
SolarAnywhere Version 3.5 Available: Improves Accuracy and Enables Bifacial Project Modeling
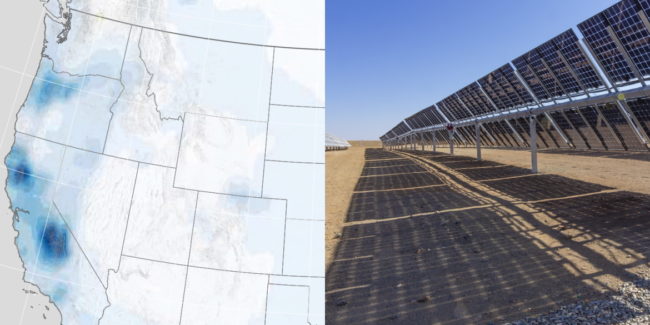
Clean Power Research is pleased to announce the launch of SolarAnywhere® version 3.5 (v3.5), which incorporates high-resolution aerosol and albedo data to improve accuracy and enable more accurate irradiance modeling, including bifacial project modeling. SolarAnywhere...
No Results Found
The page you requested could not be found. Try refining your search, or use the navigation above to locate the post.
3 steps to reducing solar customer acquisition costs
In anticipation of the soon-to-be released NREL report that benchmarks solar soft costs in 2010, plenty of media attention is being given to soft-cost reduction strategies. According to NREL’s data, customer acquisition and system design make up 11 percent of the cost...
20-million solar calculations served
This week, the engine that powers Clean Power Estimator® calculated its 20-millionth solar estimation (at least since we started counting). This marks a milestone for Clean Power Research and is a bellwether of industry growth. Since it launched in 1998, the rate of...
WSJ analysis reveals a truth about the economics of solar: sunlight is just one factor
Would you believe that Denver and Los Angeles have a similar return on a solar investment? Or that Brooklyn has better returns than either of those locations? Or that installing a solar system in Minneapolis or Portland, Oregon, could pay-off? These are the questions...
Gearing up for Solar Power International (SPI) 2012 in Orlando
SPI is next week in Orlando! Six of us will be there from our Kirkland, WA and Napa, CA offices. If you’re attending, please stop by Clean Power Research at booth #4058, right next to the “Energy Networking Station” in Hall B. Areas of emphasis for Clean...
The Ford Electric looks like a car and drives like a car…because it is a car
Recently Ford hosted an electric vehicle (EV) demonstration in Seattle that a colleague and I were fortunate to attend. At the demonstration, we were able to test drive the 2012 Ford Focus Electric. Not only was it very fast off the line, but we were impressed with...
Producing perfect PV fleet forecasts – at what cost?
In our last blog, we talked about the performance of SolarAnywhere® v4 PV fleet forecasts, and discussed how accuracy was a function of the PV fleet’s geographic footprint. For instance, SolarAnywhere hour-ahead forecasts in the Western U.S. were shown to have a...
Can ISOs rely on PV fleet forecasts?
PV fleet forecasts Solar forecasts are traditionally concerned with predicting the output of solar PV systems at particular locations. Consequently, much of what is known about solar forecast accuracy is centered on point validations. Fleet forecasts consider the...
How to validate PV fleet forecast accuracy when you cannot directly measure it
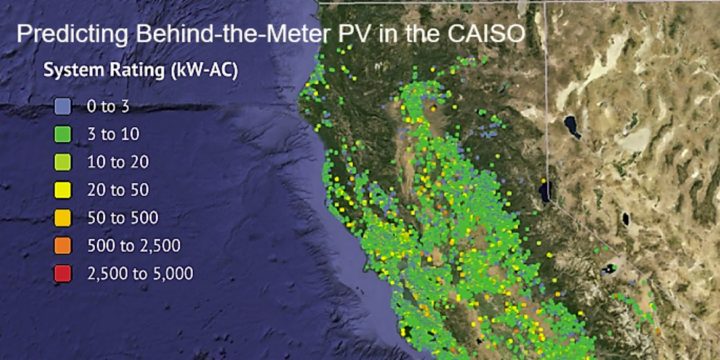
The capacity of behind-the-meter PV systems is growing steadily. Figure 1 illustrates that there is over 5 GW of PV in California alone. The number is continuing to increase. The result is that behind-the-meter PV fleet forecasts are becoming increasingly important...
Infographic: Five factors defining bankable solar irradiance data
Bankable solar irradiance data is crucial to minimizing cost of capital for solar projects. Check out this infographic to find out what you need to know when selecting resource data. Want to see the infographic in full size? Download it now: Download...
Quantifying the “variability” in variable solar energy forecasts
Utilities and grid operators need to procure and provide generation sources for anticipated load demands. As both grid connected and behind-the-meter photovoltaic (PV) systems continue to grow in number, total system load, including the load being served by solar, is...
The proof is in: Integrating PV into the grid is better with behind-the-meter solar forecasts
In recent years, Clean Power Research created a solar forecast method to accurately predict power production of “invisible,” behind-the-meter PV systems—typically those found on homes and commercial buildings. In our approach, forecasts are generated by simulating the...
Solar Power International 2015: Solar in Disneyland
Disneyland provided the backdrop for the Solar Power International (SPI) conference in Anaheim this year. As the biggest solar-focused conference in the U.S., exhibiting at SPI provides a great opportunity to find out firsthand what is on the mind of the industry—that...
West vs. south: Why change the orientation of your solar PV system
Originally published in the March/April issue of Solar Today. Within the solar industry, it's common knowledge that the optimal orientation of solar photovoltaic (PV) panels in the Northern Hemisphere is typically south, to maximize electricity production over the...
UVIG technical achievement award presented to Tom Hoff
Last week, the Utility Variable-Generation Integration Group (UVIG) recognized Tom Hoff, Clean Power Research founder and president of Research and Consulting, with an award for his ongoing contributions to solar forecasting. The ability to forecast the output of tens...
No Results Found
The page you requested could not be found. Try refining your search, or use the navigation above to locate the post.
No Results Found
The page you requested could not be found. Try refining your search, or use the navigation above to locate the post.
MN Solar Pathways: Illuminating pathways to 10% solar
On March 30, 2017, the Minnesota Department of Commerce along with its core team, kicked off its Department of Energy-funded MN Solar Pathways project aimed at finding the least-risk, best-value solutions for MN to achieve its solar energy goals. Clean Power Research...
Can a simple model predict future PV adoption? (Yes—if done right)
Utilities across the U.S. are eager to know how much PV their customers will adopt, as this adoption can impact both revenues (from reduction in energy purchases) and costs (linked to distribution operation and intermittency mitigation). Having seen the explosive...
DERs take center stage at DistribuTECH
At the recent DistribuTECH Conference in San Diego, more than 13,000 attendees spent three engaging days discussing the biggest issues facing utilities today. One of the hottest topics, judging by session attendance and exhibit floor conversations, was Distributed...
SolarAnywhere detects calibration error in nation’s most trusted ground site
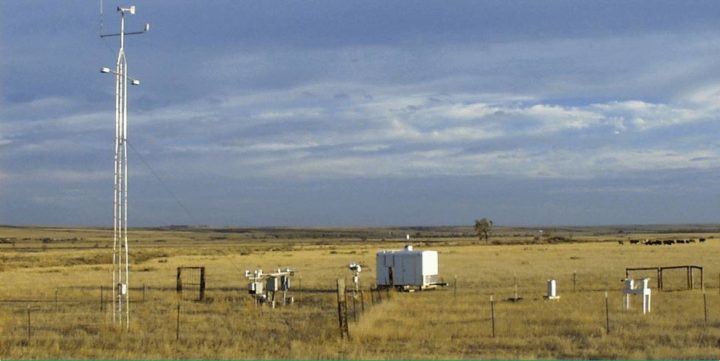
How accurate are SolarAnywhere® irradiance data? They are accurate enough to identify an undetected calibration error at one of the nation’s most trusted ground truth stations. Figure 1 presents Direct Normal Irradiance (DNI) and Global Horizontal Irradiance (GHI)...
NARUC aims to level the playing field for cloud software
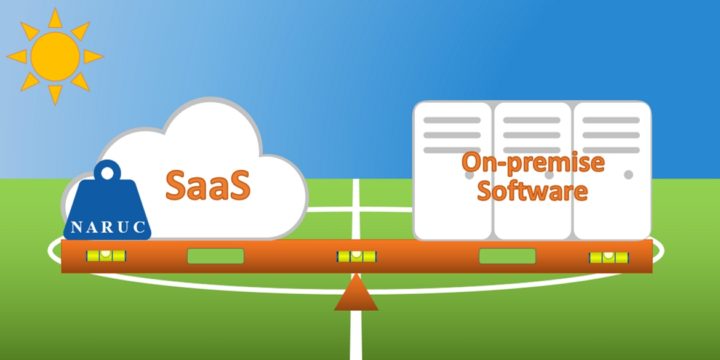
In November 2016, the National Association of Regulatory Utility Commissioners (NARUC) approved a resolution encouraging State regulators to level the playing field for cloud software and on-premise software. Why is this resolution critically important for utilities?...
Electric vehicles provide large GHG reductions in Minnesota
This week’s blog post is a contribution from our guest author Dane McFarlane, of Great Plains Institute (GPI) and was originally published on GPI's Better Energy, Better World. To learn more about how Clean Power Research is helping customers understand the value of...
100K applications in PowerClerk Interconnect & 500K in all PowerClerk products
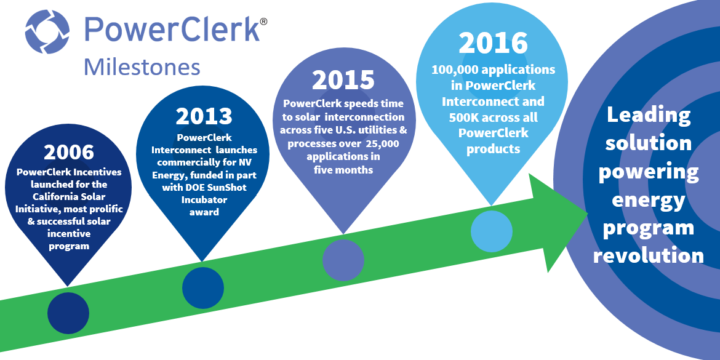
The proliferation of distributed energy resource (DER) adoption, particularly solar, across the U.S. in recent years has led to a common pattern of records being set for utilities, installers and more. Along those lines, last week marked an important achievement for...
Version control: Your bankable signpost in a digital world
If you own an iPhone, you’ve seen the familiar message “iOS 9.3.3 is available for your iPhone and is ready to install.” If you’re like me, you hit “Remind me later” a few dozen times before you actually install the update. Call me paranoid, but I always have to take...
Paradigm shift for U.S. utilities: “Energy” efficiency, not “electric” efficiency
Stagnant load stinks If you're a regulated utility in the United States, stagnant or declining load stinks. Policies like decoupling help a little, but like any other business, no utility really wants to face the economics of declining use of their product. If one...
