While we all know that the energy production of solar PV systems can vary temporally on the short term (e.g., hourly and daily basis), monthly to annual variability can significantly affect the ongoing status of a developed PV solar asset. For developers and owners of...
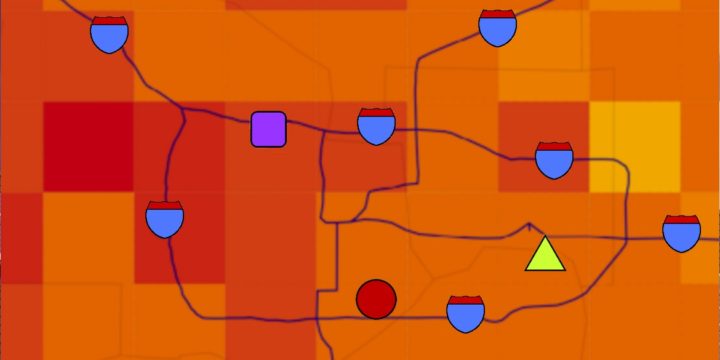
Understanding PV variability: Affects of the 2014 California monsoon
Read More