
In 2014, we covered a wide range of topics on the Clean Power Research blog, from the differences between solar resource datasets, to deep dives into value of solar calculations. The top three posts of the year followed suit, reflecting interest in topics that address the impacts of a rapidly growing solar market to utilities, the solar industry and solar owners.
So without further ado, here are our top three most-read posts of 2014.
3) 2014 solar trends episode 1: The Phantom Meter

In this post, Mark Liffmann put forth a path to reasoned and transparent discussions around net energy meeting (NEM), while predicting the NEM battle would reach a fever pitch in 2014. This prediction proved true, with the battle raging on in 2014:
- NEM continued to grab headlines throughout the year, with half of the 44 states with NEM currently in place reviewing their NEM policies, including California, South Carolina, Massachusetts and Colorado.
- A number of states considered adoption of fixed fees for NEM customers, including Wisconsin, New Mexico and Missouri.
- The question about whether NEM shifts costs to ratepayers continued, with studies claiming both residential and commercial PV solar systems provide benefits to non-solar ratepayers.
- Minnesota went the way of Austin, Texas, by adopting statewide Value of Solar Tariff guidelines. Even the U.S. Internal Revenue Service got involved when questions arose about whether payments received by solar owners under value of solar tariffs would be considered taxable income.
Early indications are that this is a trend that will continue strong into 2015.
2) Transparency in the value of solar: When 9 cents equals 12 cents
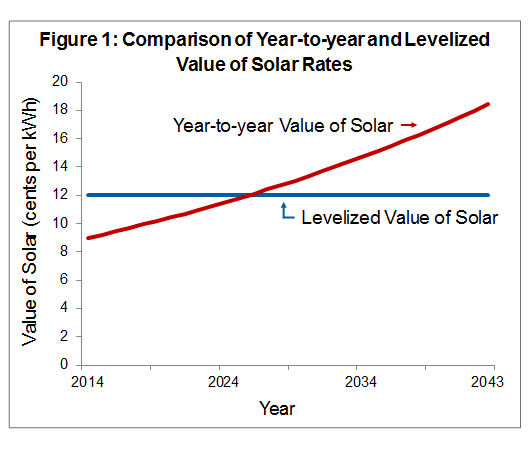
Central to discussions around NEM are the methodologies used to calculate the value of solar to utilities. There are many variables to consider in value of solar studies—from the methods and input assumptions used in a study, to the quality of data used in the calculations.
Given the importance of these studies, it’s no wonder that Ben Norris’ article, which explained how it’s possible that “nine cents equals 12 cents” when all other things are equal, was the second most popular post of the year. This example sheds light on the importance of transparency when reporting value of solar study results.
1) Infographic: Keeping Track of Solar
We’re excited that our “Keeping Track of Solar” infographic was our most popular post of the year, as it highlights one of the key values of PowerClerk®: the ability to track PV specifications. Since its inception, PowerClerk has helped utilities and energy agencies streamline incentive (and more recently interconnection) administration by taking the application process online.
An important benefit of the online process is that by nature, it captures and stores information programmatically for use in downstream processes. As Scott Tewel illustrates in the infographic, this accessibility has proven invaluable to the solar market as well as to utilities and independent system operators who need to reliably integrate distributed solar into the electric grid.
Looking ahead to 2015
Start off 2015 with a look at our predictions for 2015 and come back through the year for the latest news, research and information. We’ll be covering topics ranging from how utilities are evolving their customer engagement strategies, to deep dives into solar resource options, and much more.