
Much like Kermit the Frog and Fozzie the Bear passing a fork in the road , the explosive growth of solar has many in and around the solar industry exclaiming in Kermit-like fashion, “I don’t believe it.” No longer is solar relegated to being the energy option when no other options are available (e.g., space satellites, remote cell towers or oil rigs), nor is it the electricity source that represents less than a tenth of a tenth of a percent of electricity generation.
Rather, FERC filings reveal that large solar installations comprised 21% of all generation capacity additions in 2013, allowing solar to finish 2013 as the second largest source of new generation capacity behind natural gas. This number would be even higher if it included new smaller-scale (e.g., residential) systems.
Reconsidering the solar value proposition
Given solar PV’s more prominent position among generation resources, a number of states are taking a fresh look at PV’s value proposition, including Arizona, California, Colorado, Hawaii, Minnesota and North Carolina, to name a few.
One particularly interesting example is the State of Minnesota. The first state to pass Net Metering legislation, Minnesota is once again setting precedent by objectively comparing the benefits and costs of PV to those of traditional generation resources. To do this, Minnesota is creating a Value of Solar (VOS) Methodology that investor-owned utilities could use to determine the value of electricity produced by distributed PV resources on an annual basis.
Despite the relatively small installed PV capacity in Minnesota, this approach has captured significant national attention as utilities, regulators and the PV industry contemplate the best way for PV to adapt to its new position within the electrical grid.
Factoring in avoided costs
Regardless of the particular method by which PV’s value proposition is assessed, PV as a generation resource presents a number of benefits as well as some costs. The most obvious of these is the benefit that PV provides from avoided fuel costs (e.g., the cost of natural gas). However, PV also provides additional benefits to the grid centered around deferred or avoided generation capacity increases, as well as deferred or avoided transmission and distribution capacity increases.
In order for PV to effectively defer or avoid capacity increases, distributed PV production must help reduce the utility’s peak generation-load, peak transmission-load, and/or peak distribution-load, thereby reducing the need for additional infrastructure. To determine whether such peak-load reductions occur, two load-matching factors are commonly used:
- the effective load-carrying capability (ELCC); and
- the peak-load reduction (PLR).
The ELCC is applicable to generation and transmission load reductions, while the PLR is applicable to distribution load reductions.
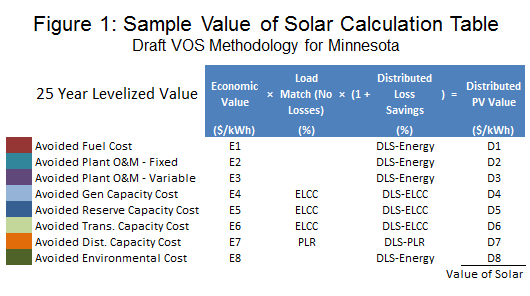
In a recent VOS study, ELCC and PLR avoided capacity costs contributed roughly 25% of PV’s value, making them two critical factors in the calculation of PV’s value. This is clearly illustrated in Figure 1 below (borrowed from Minnesota’s draft VOS Methodology), in which the ELCC and PLR factor into the calculation of four of the eight PV value components that Minnesota has proposed in its draft VOS Methodology.
Calculating ELCC and PLR
ELCC is a statistical measure of PV’s effective generation capacity. Although there are different methods used to calculate ELCC, they all require an analysis of how PV reduces loads during top load hours of the year. For example, under Midwest Independent System Operator (MISO) rules, the PV output is averaged for all hours ending at 2 p.m., 3 p.m., and 4 p.m. during June, July and August over the most recent three years. To the extent that PV output is high during those critical hours, PV will provide beneficial capacity to the system, and it will be assigned a high ELCC.
PLR is a more straightforward calculation: determine the peak load reduction attributable to PV on the distribution substation. Note that in this case, PV output in only a single, highly critical hour is relevant. If the local distribution load peaks late in the day or after sundown, then PV in that area provides no capacity benefit. If the peak hour is in the middle of the afternoon, then PV will likely be assigned a high PLR.
Whether calculating ELCC or PLR, utilities require analysis tools to perform the calculations correctly. Utilities need measured load data for every hour, and they need corresponding PV production (metered or modeled) for every hour.
In Part 2 of this post, we’ll discuss the critical data and analytics necessary to navigate to ELCC and PLR, and arrive at a new understanding of the value proposition of solar.