Stagnant load stinks
If you’re a regulated utility in the United States, stagnant or declining load stinks. Policies like decoupling help a little, but like any other business, no utility really wants to face the economics of declining use of their product.
If one view sums up the current dilemma for the U.S. utility, it’s Figure 1. According to data from the U.S. Energy Information Agency (EIA), from the end of World War II through 2007, overall production of electricity in the Unites States climbed fairly steadily. It roughly mirrored overall Gross Domestic Product (GDP) growth.
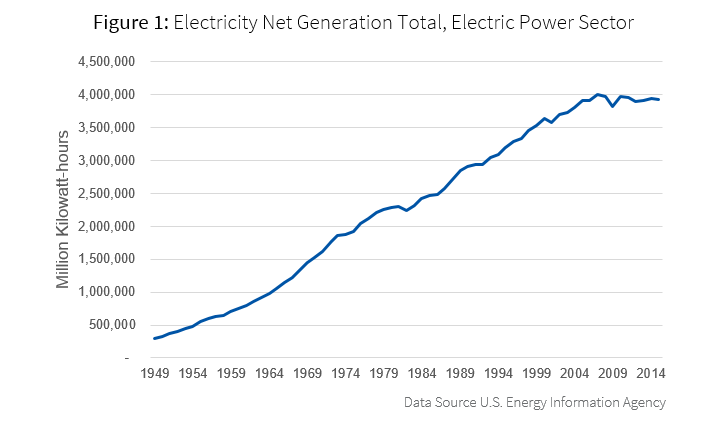
The rise in air conditioning and home electronics roughly made up for the loss of load growth from heavy industry since the 1970s. In 2008, the Great Recession hit and the sag in electricity production looked like similar recessions in 1981-1983, 1990-1991 and 2000-2001. In 2010, electricity production bounced back strongly, but then something odd happened.
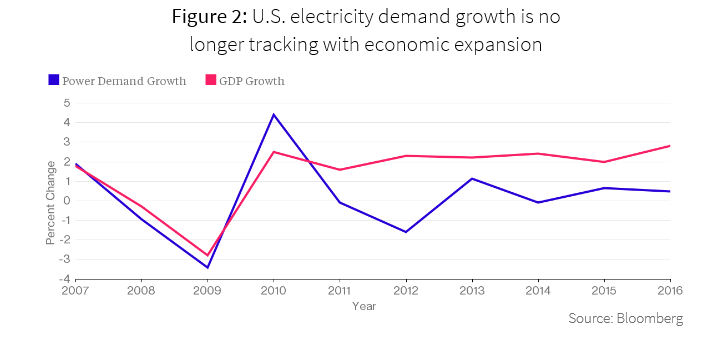
From 2010-2015, electricity production in the United States stagnated or declined, despite overall growth in GDP. Essentially, electricity growth became decoupled from GDP growth. This is shown in Figure 2, below, from Bloomberg.
Don’t fear the bogeyman
Without looking at the data and only reading stories in the media, one might jump to the obvious conclusion: distributed solar is causing the death spiral of the American utility. Like a lot of obvious conclusions, it’s inconsistent with the data. According to EIA data, distributed solar accounted for just 0.3% of electricity supply in 2015. Distributed solar may be a significant cause of future load declines, but it barely registers in this time period. See our earlier blog post for reasons that distributed solar may not be much of a fear into the future.
Likely causes of stagnant load
Unfortunately, the EIA doesn’t seem to have published any research exploring the causes of flat lining electric production since 2010. That leaves us to informed speculation regarding root causes. Load stagnation is likely due primarily to energy efficiency, driven by two big factors: technology and policy.
Looking at EIA data, the downward trend in industrial electric consumption continues through this time period unabated. The real difference in electric consumption came in the dropping growth rates of residential and commercial electric consumption. There are three big technology shifts that hit during this time period:
- Between 2005 and 2007, the use of compact fluorescent lightbulbs (CFLs) grew rapidly from about 5% market share to over 20% market share. CFLs last roughly 5-7 times longer than incandescent bulbs and consume 75% less electricity. This shift started a rapid decline in electricity consumption from lighting.
- During this time, home appliances were getting a lot more efficient. Televisions were switching from plasma and tube, to LCD and LED. Desktop computers were replaced by laptops and tablets.
- Finally, electric consumption from air conditioning was beginning to level out.
Over this same time period there was one important policy change that also contributed to the decline in electric consumption. In 2007, the United States passed the Energy Independence and Security Act of 2007. This bill had a number of energy efficiency mandates. Notably, it essentially mandated a switch to higher efficiency light bulbs, making incandescent bulbs uncompetitive.
Time for a paradigm shift: Energy efficiency, not electric efficiency should be the focus
Without change, U.S. electric utilities are likely to face growing challenges in the years ahead. A continued focus on electric efficiency will likely challenge the utility bottom line in the 21st century. Also, electric efficiency alone offers only limited opportunities for significant improvements in energy usage in the years to come. However, a broader focus on energy efficiency and not just electricity efficiency could be good for U.S. consumers, good for U.S. utilities and good for the environment.
Utilities are already starting to take action. As an example, at our recent webinar “Electric Vehicles: Increasing the Bottom Line for Consumers and Utilities,” 53% of utilities reported that they have an electric vehicle program, and another 18% indicated they are planning to implement one.
Figure 3a shows the typical energy usage of a California household, including transportation, with the area of the boxes proportional to the energy consumed. As can be seen, about 90% of the energy used by the household is for transportation, heating and water heating. Only about 10% of the energy used is for electricity.
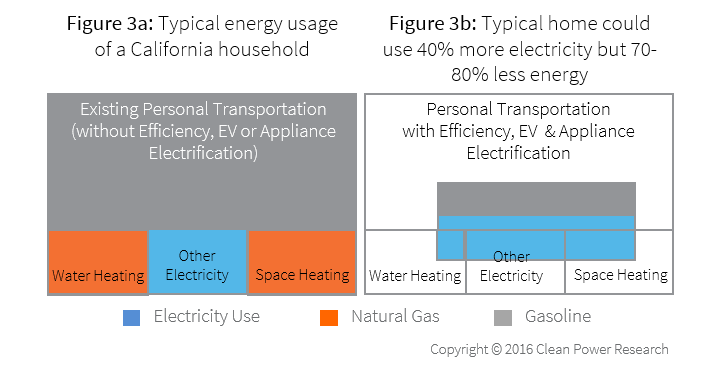
The traditional utility energy efficiency program has focused on just a small fraction of household energy usage. There are three technology opportunities that would allow this same household to use dramatically less energy and dramatically more electricity:
- Electric vehicles
- Heat pump water heaters
- Heat pump space heaters
As described in the Solar+ homes article series, by taking advantage of the tremendous efficiency gains of electric motors and heat pumps, this same typical home could use 40% more electricity, but 70-80% less energy (see Figure 3b).
If utilities and their regulators broaden their focus from electric efficiency to energy efficiency, U.S. utilities can grow load while driving down costs for U.S. energy consumers.
Driving energy efficiency
To drive consumer behavior, utilities need to think about awareness, engagement and enrollment. It’s no secret that digital has transformed how consumers learn, research and engage, but the digitally engaged energy consumer also unleashes more business value for energy providers. For example, 41% of digital consumers state that they trust their energy provider to help them optimize their energy consumption versus 31% of non-digital users.
Utilities must focus on a digital approach to driving energy efficiency awareness and engagement. With modern rate schedules, the economics of electric vehicles, heat pump space heaters and heat pump water heaters are complex. These decisions can be made easy with personalized, digital engagement tools like WattPlan®.
A new paradigm for the 21st century utility (and their regulators)
It’s time for a new paradigm in energy efficiency. In the new paradigm, utilities and their regulators look holistically at overall energy use, and drive programs that reduce energy use, not just electricity use. In fact, many of these programs (electric vehicles, heat pump water heaters and heat pump space heaters) will increase electric use. Utilities will use best-in-class software tools to efficiently drive awareness, engagement and enrollment in new energy efficiency programs.
In this new paradigm—energy efficiency, not just electric efficiency—is good for the utility, good for the consumer and good for the environment.