Wildfires diminished total sunlight in September 2020 by up to 20%, driving potential PV plant production risk
Disaster preparedness—understanding and mitigating losses due to wind, hail and fire—is now a mainstream topic in the solar industry. In the United States alone in 2020, NOAA recorded 22 separate disasters that exceeded $1B each in damages. The tally shatters the previous record of 16 set in 2011 and 2017. In this article, we look back at solar availability in 2020 in South America and Europe based on satellite-derived SolarAnywhere® Data. We also take a deeper look at the impact of wildfire smoke in North America that suggests wildfires now drive production risk for certain power plants.
South America
Chile and Argentina had a sunny 2020. Insolation was 5% or more above average depending on the location. Observations of aerosol impacts in Brazil support other evidence of severe wildfires there. According to Brazilian government agencies, the number of wildfires rose to a decadal high.
Europe
It was all sunshine in Northern Europe. Solar systems in parts of the United Kingdom, Germany and France received 5% or more sunlight (annual GHI) than is typical. Italy also had a good year for solar generation. Portugal and Spain were not as fortunate, ending the year a few percent below average. The positive deviations for the year got a jump start from an exceptionally sunny first half (January – June 2020). As we wrote last year, the deviations were driven by reduced cloud cover and to a much lesser extent the COVID-19 related reduction in aerosols.
North America
In the U.S., global insolation was a few percent below average in the Southeast, potentially good news for owners who can attribute a dip in production to the weather. In contrast, solar owners in Minnesota and Maine had a relatively good year.
Much of the West, including Nevada and Arizona, enjoyed insolation 2-5% above average. In California, Oregon, Washington and Colorado, the regions most impacted by wildfires finished the year a few percent below average. Note, however, that the full impact of the wildfires on solar generation was greater than described in these visualizations because aerosols disproportionately impact direct irradiance. The effect is particularly noticeable for tracking PV arrays since they benefit more from DNI than fixed-tilt systems.
The impacts of wildfire smoke on solar resources
2020 was the most active wildfire season in recent history in Oregon, California and Washington as measured by acres burned and fire detections. Smoke particles, and more generally aerosols in the atmosphere, diminish the solar radiation available for solar generation.
A recent study in the California Independent System Operator (CAISO) region found that solar-powered generation during the first two weeks of September 2020—a time when California was heavily impacted by wildfire smoke—was down 13.4% from the year prior despite an increase in total system capacity. Climate modelers have long projected that hotter and drier conditions likely will cause increased fire activity across the United States in coming decades1.
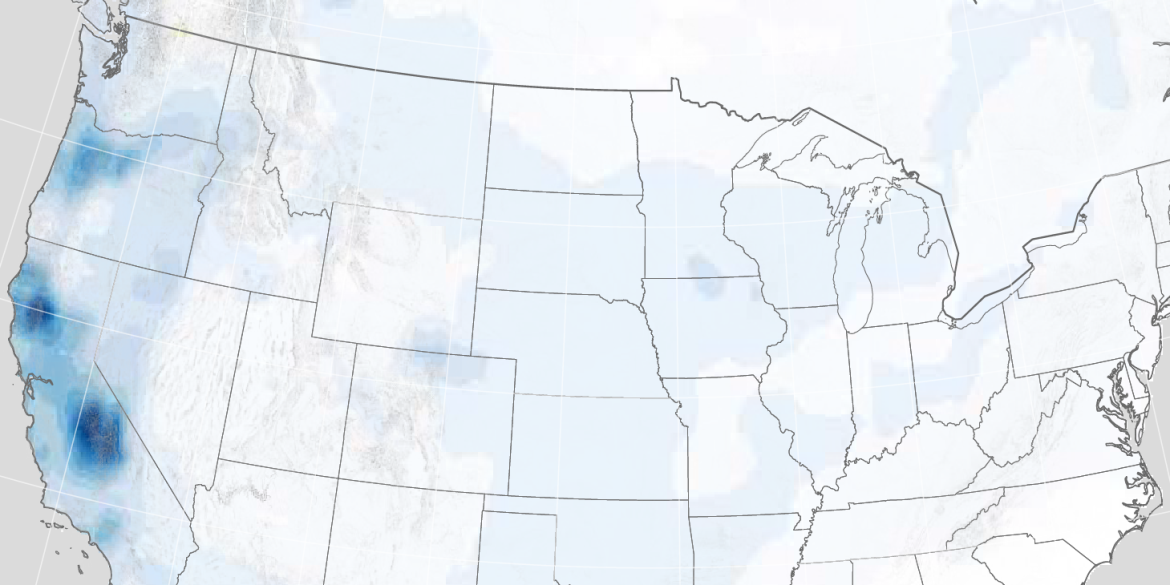
New analysis by Clean Power Research quantifies the impact of wildfire smoke on solar-powered generation. When North American wildfires peaked in September 2020, aerosols visibly dimmed sunlight across much of the region. In fact, total sunlight (GHI) for the month was diminished by a staggering 20% in some locations, as illustrated in the map below. This included California’s Central Valley and parts of the Columbia River Basin (including Portland and Bend) that were hardest hit by the smoke.

The wildfires continued through October. In Colorado, October snow slowed, but could not stop, the blazes. Colorado suffered the three largest fires in the history of the state.
2020 milestone: In some locations, wildfire smoke exceeded the annual impact of clouds
Modeling of clear sky direct normal insolation (DNI), the direct sunlight on a cloudless day, illustrates the length and severity of the wildfire season. The impact of the 2020 wildfire season on insolation was more than double that of any previous year studied (back to 2001) for locations in California’s Central Valley and Northern Colorado.

Timeseries modeling of a tracking PV system located in California’s Central Valley shows August- October 2020 deviations totaled -122 MWh/MW-DC, equivalent to -5.8% of the typical year energy output. 2020 was the worst year on record (back to 2001) for tracking PV energy production in this location.
Soiling from ash and more generally increased particulate matter was likely an additional drag on performance. NREL has found that particulate matter (i.e., PM10 and PM2.5) is highly correlated with soiling.
The analysis indicates that we passed a grim milestone in 2020: In some locations, the annual impact of wildfire smoke exceeded that of clouds or what could normally be called weather when studying solar variability. The implication is that wildfires now drive production risk for certain power plants. In addition, climate risk assessments of solar assets may include potential changes to the solar resource.
About this analysis
SolarAnywhere V3.5, in testing at the time of this post, incorporates high-resolution aerosol data to better model aerosol events such as smoke. The full analysis of wildfire impacts and validation of the updates in V3.5 are planned for publication later this year.
Leverage SolarAnywhere expertise
If you need real-time, site-specific solar data and intelligence so that you can improve reporting and decision-making for your fleet, consider licensing SolarAnywhere services including SystemCheck® and Sites.


