
Utility processes and systems impacted by distributed PV
In previous blog posts, we’ve looked at how the growth of distributed PV can impact grid operation at the system level. These blogs addressed how distributed PV can lead to the often referenced “duck curve,” and how SolarAnywhere® FleetView® software can be used to mitigate this impact. The impacts of distributed PV, however, extend beyond the system level to the substation, feeder and even sub-circuit levels, as will be discussed in this article.
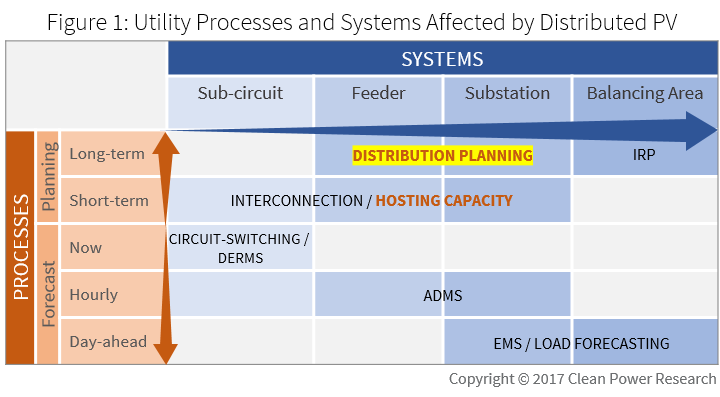
Figure 1 identifies the utility processes and systems that need to be adapted to account for the growth of PV on the distribution grid. The processes and systems impacted span long-term planning, to hourly and day-ahead forecasting, as well as from an individual sub-circuit to an entire distribution area.
As a first post exploring the adaption of utility processes and systems, we’ll dive into the processes of hosting capacity and distribution planning, and discuss how distribution engineers can use existing tools to improve their current processes.
Distribution planning and hosting capacity: It’s time to model reality
Before distributed generation, utilities modeled their grid by focusing only on the consumer load that needed to be met. Today, however, many utilities across the U.S. are focused on calculating the PV hosting capacity of their feeders, and on understanding how distributed PV may alter their existing distribution planning. Conveniently, both challenges fall in the hands of the distribution engineer and require similar knowledge of distributed PV.
Today, the distribution engineer’s tools of choice (CYME, EDD, Milsoft, Synergi and others) often do not contain knowledge of where behind-the-meter distributed PV is located, the rate at which it’s growing, or the irradiance data needed to simulate PV production.
As a result, distribution engineers are not readily able to:
- Simulate PV production at the feeder-level
- Determine differences in PV installation rates between feeders
- Simulate PV on an 8760 basis in a manner that is time-correlated with load
Without these capabilities distribution engineers cannot:
- Capture the contribution from existing PV to their load today
- Account for differences in PV installation due to customer demographics
- Understand the differences between sunny, overcast and partially cloudy days
This lack of information and capability leads distribution engineers to often apply overly conservative (but not necessarily accurate) tests when determining hosting capacity. As a result, they find themselves applying generalized PV adoption metrics when undertaking distribution planning processes. This hurts the utility and its ratepayers in two ways.
Two impacts of not accounting for distributed PV
The first way not accounting for distributed PV hurts utilities and their ratepayers is through the regulatory process. The evident short-comings of current modeling processes (e.g., failing to time-correlate PV production with system load when simulating power-flow) gives regulators reason to doubt the findings of the utility. This is dangerous for all stakeholders since the utility is responsible for the safe and reliable operation of the grid.
The second and less obvious way is through the utilities’ annual distribution grid investments. These investments are becoming progressively riskier as DER adoption and technological change continues to transform the way the grid operates. If these investments become stranded assets, cost recovery will protect the utility in the near-term, but will also lead to rate increases, exposing the utility to further DER adoption. As such, utilities and their ratepayers are dependent upon the utility making the best investments possible to minimize costs and maximize everyone’s return on investment.
Improve your processes by using your data
The good news for utilities is that the information they need to improve their processes is often being captured through the customer interconnection process. Most utilities are now aware that they should be capturing PV system size, location, orientation, tilt and components as part of their interconnection process. For utilities using PowerClerk®, this information has been captured since they started using PowerClerk.
Over the past two years, the SolarAnywhere team at Clean Power Research has been working with leading utilities to incorporate their existing distributed PV data into their hosting capacity and distribution planning processes. Using SolarAnywhere® FleetView®, our utility partners have changed the way they undertake distribution planning and how they calculate hosting capacity to fully incorporate the effects of distributed PV on a feeder-specific basis.
Want to take the first step?
We’re excited to be helping our utility partners engage with the energy transformation. Having worked with utilities across the country, we’re familiar with the challenges they face when incorporating the effects of distributed PV into their processes. The good news is that we take the knowledge gained from tackling each of the challenges, and build it back into our products.
If standing on the shoulders of your peers and incorporating the effects of distributed PV sound good to you, then we invite you to connect with us at support@solaranywhere.com.
Learn more about solar forecasting
Access research that demonstrates how solar forecast model accuracy changes depending on the geographic footprint of the area being forecast, and evaluates the economic impact of remedying forecast errors.