Utilities and grid operators need to procure and provide generation sources for anticipated load demands. As both grid connected and behind-the-meter photovoltaic (PV) systems continue to grow in number, total system load, including the load being served by solar, is subject to impacts from PV energy production variability. It’s important to quantify the anticipated variability in the forecast to ensure efficient integration of PV energy into grid operations.
Both hour and day-ahead solar energy production forecasts are tools being used to manage grid stability. Due to the variable nature of solar energy production, solar energy forecasts are not perfect. As a result, excess dispatchable generation capacity must be procured to ensure reliable grid operation. Clouds are the primary atmospheric source of PV production variability, yet are the most difficult to predict with high certainty. For grid balancing and other tasks made more challenging with higher penetrations of solar PV, an understanding of the variability associated with the solar energy production forecast is important for grid operators to better plan stand-by generation unit commitment, and for scheduling purposes.
Clean Power Research has developed a method that uses historical satellite irradiance data to improve the application of day-ahead forecasts to activities such as scheduling reserves. This is accomplished by using long-term historical data (specific to the location of a PV system) to characterize the variability of a particular solar PV forecast. This allows the operator to, with a higher degree of certainty, schedule just the right amount of reserves to cover probable variability in a solar PV forecast.
Growth of solar driving need for better solar energy forecasts
Around the world, the number of solar installations connected to electrical grids continues to increase. Mercom Capital recently reported that global solar energy capacity will rise to nearly 65 GW in 2016. Therefore, integrating this growing mix of solar energy into the grid will need to be managed well to minimize the impact on grid stability and reduce costs for ratepayers.
In California, solar forecasts are being used for a variety of purposes by the California Independent System Operator (California ISO), utility companies such as Pacific Gas & Electric and Southern California Edison, and other market participants. These include determining the need for operating reserves, scheduling utility scale solar plant generation and renewable energy bidding.
When the sky is clear, solar energy production is stable and prediction is straightforward. However, passing clouds introduce significant errors in the level and timing of solar energy production, which can result in ramps (sudden increases or decreases) in energy production.
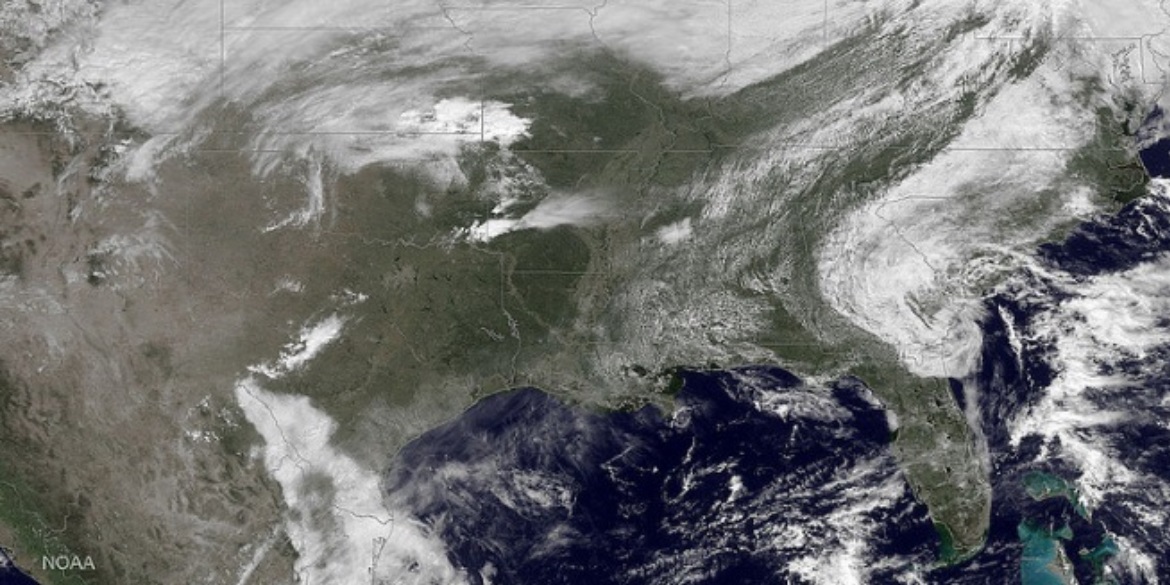
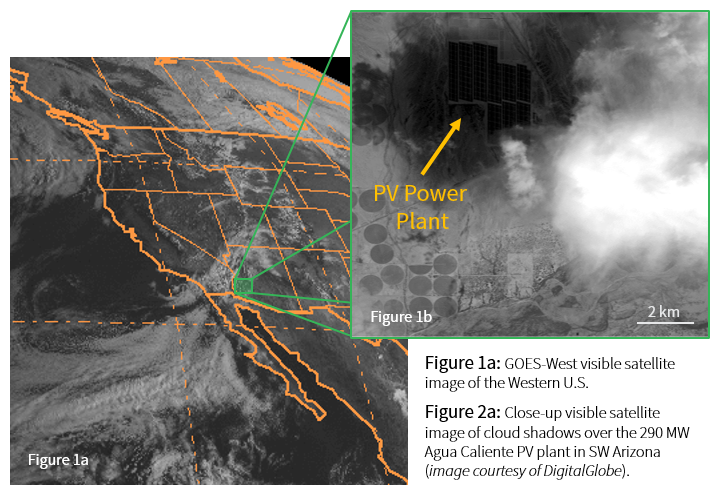
For example, Figure 1a shows a GOES satellite visible image over the Western U.S. in which there are clouds associated with a low pressure weather system over the Southwestern U.S. Figure 1b shows a cloud shadow being cast by a cumulus cloud over the Agua Caliente 290 MW photovoltaic (PV) plant in Southwestern Arizona. Cloud-cover on this particular day triggered numerous solar power ramps across the region, and suppressed PV production for a short time at the Agua Caliente PV plant. The ramps in PV energy generation continued until the clouds moved away or dissipated.
Numerical Weather Prediction (NWP) forecasts are often used to facilitate day-ahead scheduling needs for PV power plants. NWP models use mathematical models of the atmosphere and oceans to predict future weather based on current weather observations. Most NWP models do not run at spatial resolutions that are high enough to explicitly simulate clouds, and instead, rely upon parameterizations of cloud processes, which further hinders the NWP forecast’s ability to model variability in forecasted surface irradiance. Even as NWP models become more sophisticated with increased resolution, it is challenging for most NWP models to predict anticipated variability caused by small scale clouds, especially over a single PV site.
Adding smart variability to the day-ahead solar energy forecast
A common way to classify the impact cloud cover has on surface irradiance is through what is referred to as the Clearness Index (Kt), which is simply the ratio of the observed irradiance to clear-sky irradiance. The clearness index concept is visually illustrated in Figure 3. Very low values of Kt (~0.2) are associated with heavy-overcast cloud cover conditions, while clear days have Kt values approaching 1.
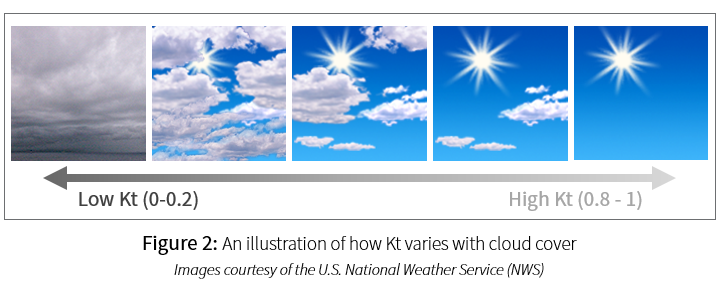
The relationship between Kt and surface irradiance variability is shown in Figure 3. While very low and high Kt values (overcast and clear skies, respectively) often have lower variability present, mid-range Kt values (often associated with partly cloudy skies) impart higher variability to surface irradiance conditions. SolarAnywhere® historical time-series data provides the resources needed to calculate hour-to-hour variability over the Kt spectrum that can be used to define the variability of NWP-driven solar energy forecasts.

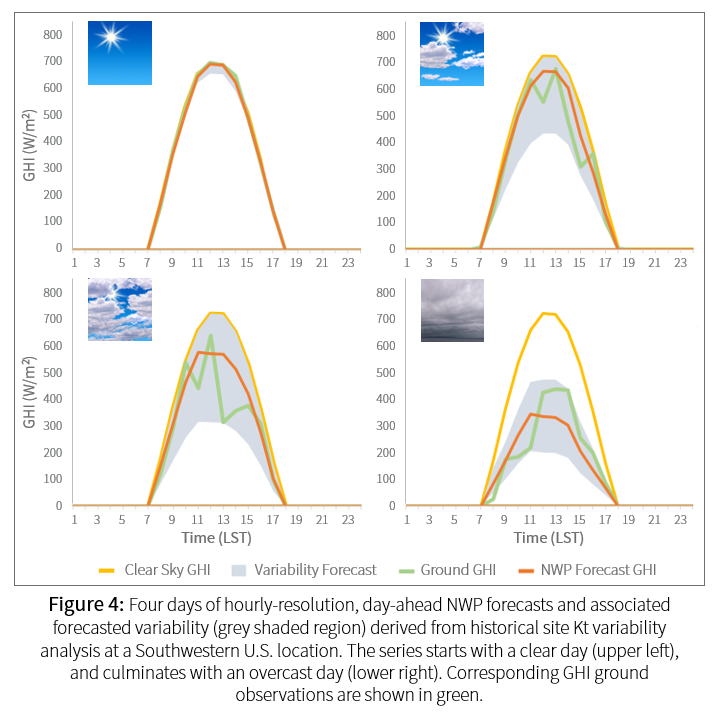
Figure 4 illustrates how forecast variability can be conveyed to NWP forecasts on a range of weather days. If the day was forecasted as a clear day (i.e., high Kt values), as in top left image, then there is not much associated variability to the forecast. On clear days like this one, utilities and grid managers do not need to line-up as much reserve power, saving money. Likewise, on days with heavy overcast (i.e., low Kt) the variability range associated with the NWP forecast is not significantly large, again enabling grid managers to make a smart decision to purchase less day-ahead reserve power.
Challenges occur when partly cloudy conditions are forecast, like those shown in the top right and bottom left of Figure 4, where the forecast variability ranges are large. The goal is to derive an envelope which encompasses the variability associated with the NWP forecast. This new forecast variability technique will add value to the solar energy forecast, and help grid operators and stakeholders make prudent reserve procurement decisions.
Conclusions
Clean Power Research is implementing an innovative forecasting method that incorporates intelligent, site-specific variability of solar irradiance at a project site to its day-ahead forecasts. This variability forecasting update will help independent system operators and other market players make smarter decisions about how much reserve generation is needed to ensure grid reliability. The variability forecast specifics are derived from SolarAnywhere historical data, and can be applied at any location covered by the SolarAnywhere data footprint.
This new technique will add value to solar forecasts, allowing the utility and system operators to confidently schedule a prudent amount of reserves, particularly on days when variable solar generation is expected. This will allow for higher penetrations of PV energy onto the grids, while minimizing grid operation costs associated with the variable output from PV generation sources.