
Originally published in the March/April issue of Solar Today.
Within the solar industry, it’s common knowledge that the optimal orientation of solar photovoltaic (PV) panels in the Northern Hemisphere is typically south, to maximize electricity production over the life of the system. Recently, however, there has been much discussion, and even incentives being offered, for orienting PV systems west.
Why should we face PV panels west? The answer lies in the fundamental requirement of utilities to provide a reliable and stable grid. In order to do so, utilities must keep the balance at any given time between the power that is being consumed (a.k.a., grid load) with that being generated from all sources, including fossil, nuclear, and renewable sources. In this mix, solar PV power represents a variable resource that is active from sunrise to sunset, and which peaks at different times during the day depending on the orientation of the PV panels.
In low PV penetration scenarios, where little rooftop PV has been installed, both variability and peak production would have little or no effect on grid stability. However, in areas with high PV penetration, PV power variability and peak production will affect the grid in different ways. With respect to variability, PV production swings can be handled by a high quality and accurate forecast in combination with an adequate supply of “spinning reserves”—fast-responding and relatively expensive generating technologies. Power production variability is very similar for both south- and west-oriented systems.
Timing the grid load
PV production can also impact the grid based on the time of day power is produced. As the number of installed systems (most of them facing south) increases, the grid load will be reduced during the central hours of the day. This results in a more prominent load peak in the late afternoon hours, when there is less power produced by solar, and electricity loads peak due to the use of lights, appliances, air-conditioning systems, water heaters, etc., in homes after work and school.
It is during these times—when PV energy production does not line up well with peak electricity demand—that utilities face a problem. Traditionally, utilities have relied more heavily on spinning reserves to meet afternoon load demands. To alleviate the need for expensive reserve options, utilities and energy agencies are looking for creative solutions to help alleviate afternoon peak loads.
One such solution is orienting solar PV panels to the west so that they produce more power in the afternoon during peak load times. This is one of the main drivers for the incentive the California Energy Commission is offering in California to users who install west-facing rather than south-facing systems.
To better understand how west-facing PV systems can help alleviate peak electricity loads, let’s look at the real net load reported by the Pacific Gas & Electric Company (PG&E) during August 2014. Figure 1 shows the grid load (gray) from Thursday, August 21, to Sunday, August 24. For illustrative purposes, the chart also shows simulated PV production for 1,000 megawatts (MW) of distributed PV, which is roughly equivalent to the currently installed distributed PV capacity in the PG&E territory. The orange line is the production profile if all the simulated systems were facing south, and the blue line represents west-facing installations.
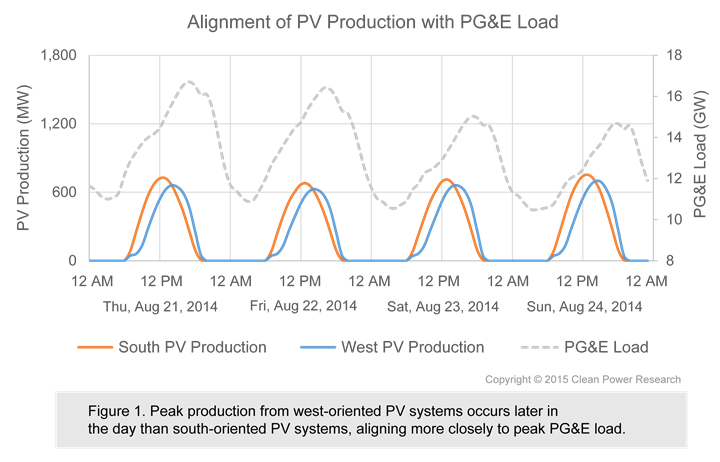
Figure 1 allows us to observe how south and west PV system orientation energy production can affect the grid. South-facing systems produce the most energy earlier in the day, while west-facing peak production is focused later in the day, coinciding more closely with peak electricity load during this period. In the case of Friday, August 22, the peak load occurred at approximately 6:00 p.m. local time. While south-facing systems would have peaked at approximately 1:30 p.m., the west-facing systems would have peaked at approximately 3:00 p.m., producing more power during the remainder of the day when needed most by the utilities.
It is also interesting to note how the grid load is dynamic, in that it is greatly affected by both residential and commercial uses. In this example, weekday electric loads peaked when people returned home after work. On weekends, when many offices are closed, the overall load was lower.
While south-facing PV systems produce more power overall than west-facing PV systems, from a utility standpoint, the impact of the losses in overall PV production of west-facing systems are likely to be more than offset by the value of the reduction in the peak load.
Consider your roof, other factors
From a PV system owner standpoint, systems oriented to the south have traditionally been preferred, as they typically generate the highest overall power. However, there are a variety of factors that dictate the orientation of rooftop systems. Usually the roof is a deciding factor, as the house will have a fixed structure upon which to install the PV panels. While it is technically possible to give the system any orientation regardless of the roof design, the results may not always be aesthetically acceptable or affordable for the homeowner.
If there is flexibility to select the preferred panel orientation, then it is possible to run a PV production simulation for the different possibilities and select the option that produces the highest return on investment. This analysis would factor in electric rates, as well as nearby and far-horizon shading obstructions, and local weather patterns.
For example, in locations with time-of-use rates that are higher in the afternoon, west-facing panels could result in higher returns, as electricity produced from solar later in the day offsets higher afternoon electric rates. In another example, a neighboring building or a tree west of a home could tip the balance in favor of south or east orientations, while recurring morning fog during the summer months could result in west-facing systems producing more electricity overall.
The PV Power Map in figure 2 shows the relative difference in power production for south- versus west-facing systems for southern California, southwestern Nevada, and far western Arizona, for the month of August 2014. A 1-kilowatt (kW) system tilted 30 degrees is used for the purposes of this simulation.
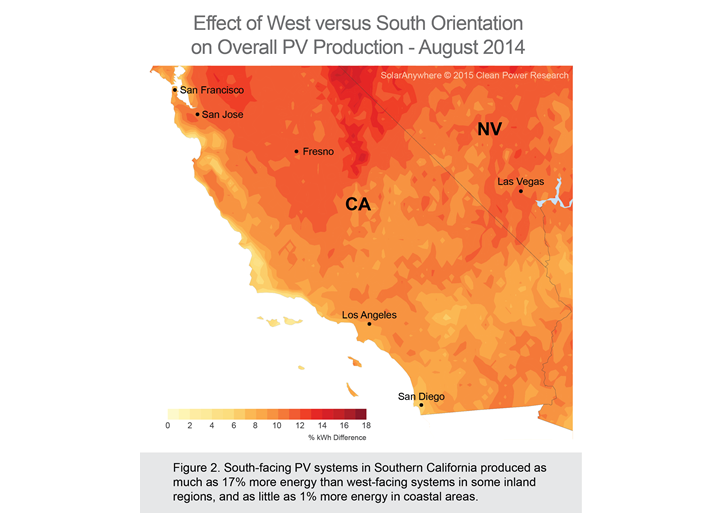
In the entire area of study, south-facing systems produced more than west-facing systems during the month of August 2014. Relative differences ranged from 1% (light yellow) to 17% (dark red). In the coastal regions, morning marine-layer stratus clouds that tend to burn off by the afternoon led to small differences in total energy production for the month. There is negligible difference in cloudy sky production between south- and west-facing PV systems in coastal locations when marine stratus clouds are present due to the inhibited direct normal irradiance.
Energy production over time
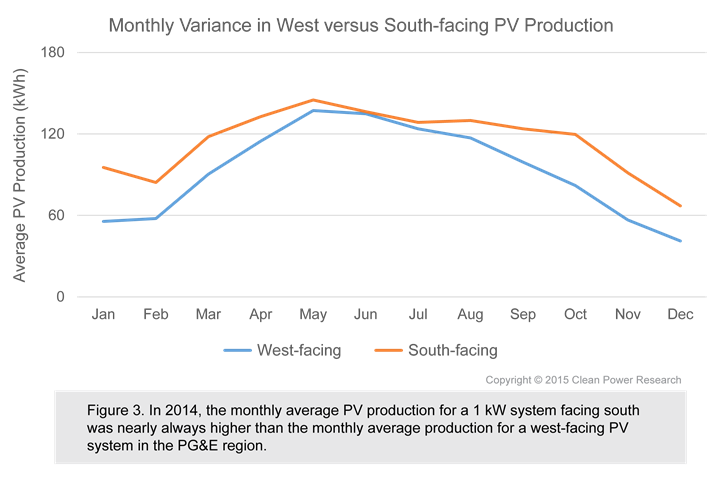
Figure 3 shows the relative difference in monthly PV energy production between west- and south-facing PV systems as it varies throughout the year. Overall energy production was higher for south-facing systems during the off-summer seasons, but nearly equalized with that of west-facing systems during the May to July time period of 2014.
While overall PV production is often maximized with the southward orientation of rooftop PV systems, westward PV module orientation can optimize power production to peak later in the day when it is often of more value to utilities and balancing authorities. Consumers should be aware of all the options and factor in all incentives when making decisions concerning the installation of rooftop PV.
Note: The PV Power Map in figure 2 was created with power output estimates generated by SolarAnywhere services from Clean Power Research; these include simulation capabilities and hourly satellite-derived irradiance data with spatial resolutions from 1 to 10 kilometers. The calculations are based on a PV system with a total 1-kW nameplate rating that is configured as five 200-watt PV panels with a 1.5-kW inverter; fixed, south and west-facing panels with 30 degree tilt; no shading; panel PVUSA Test Conditions rating of 178 watts; and inverter efficiency of 95.5 percent. Access free historical irradiance data at www.solaranywhere.com.